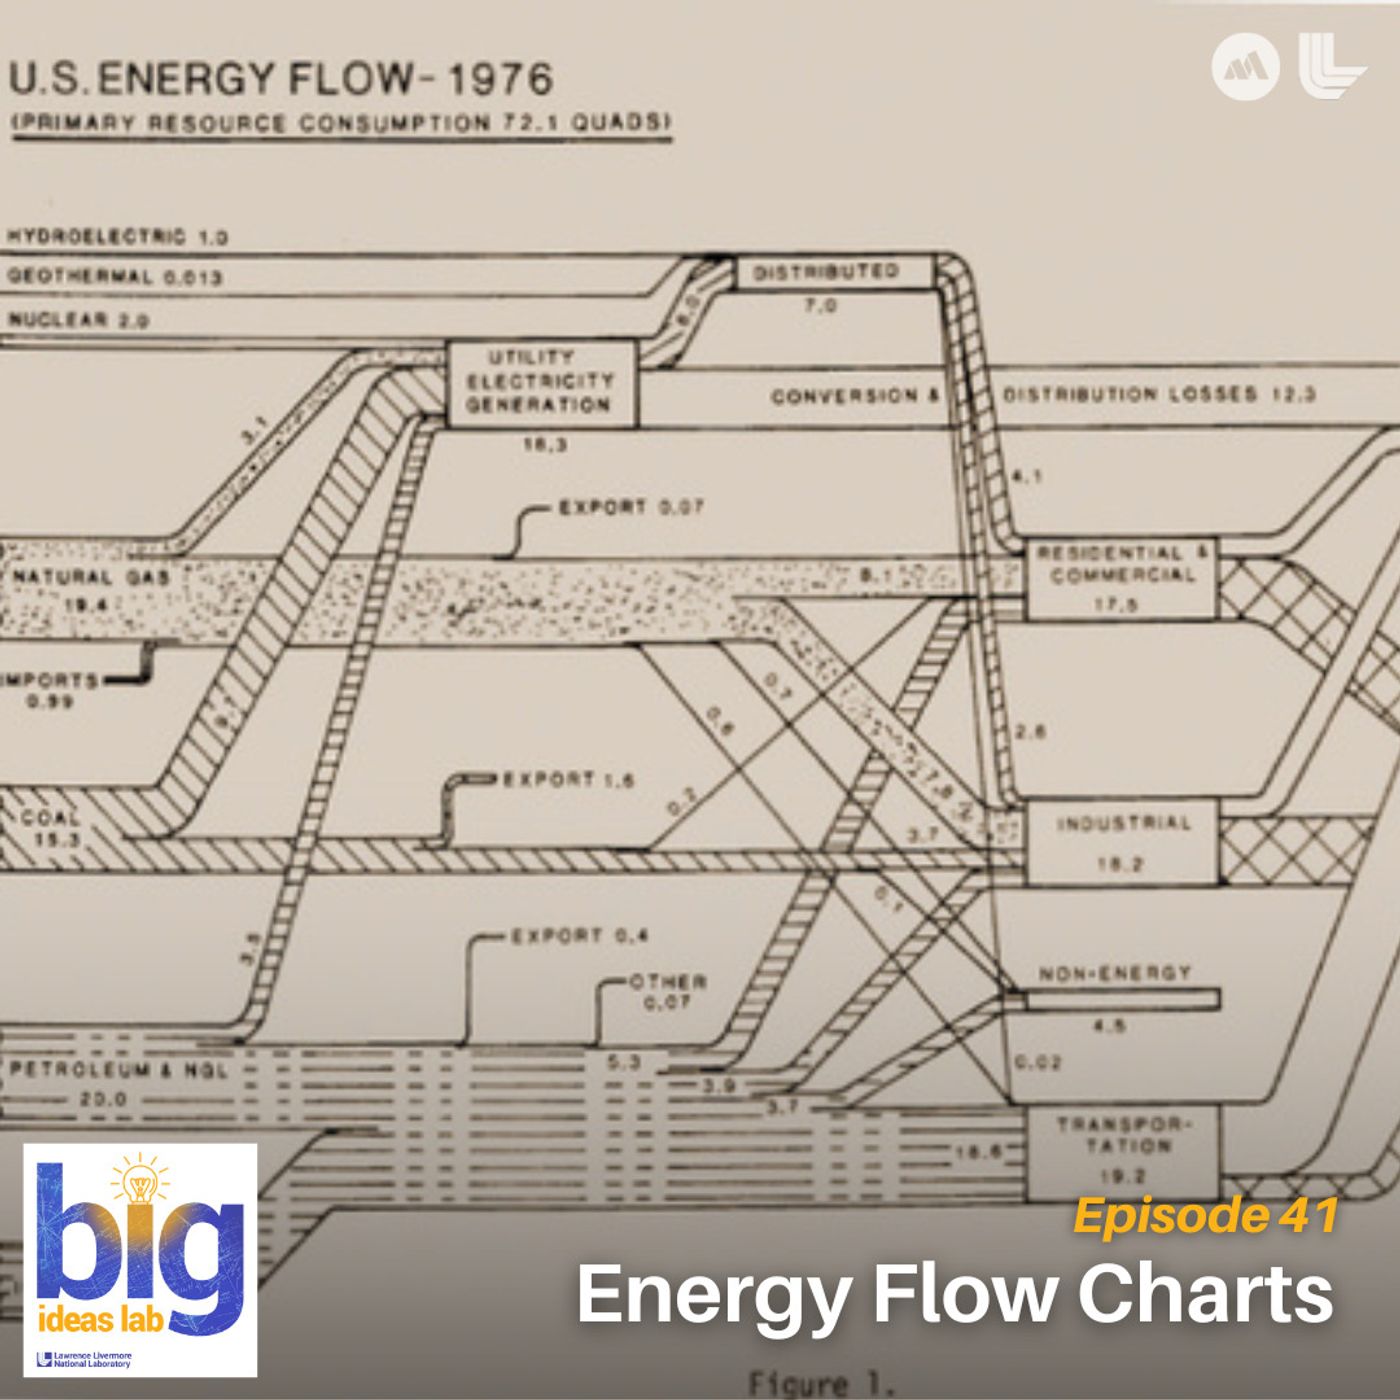
Energy Flow Charts
LLNL’s Energy Flow Charts have become one of the clearest ways to understand the nation’s energy system. Learn how these diagrams capture everything from pandemic shutdowns and shifting fuels to wasted energy we never see. From classrooms to Capitol Hill, these charts help the country plan for what comes next.
Guests featured (in order of appearance):
- Hannah Goldstein, System and Policy Analysis Group Leader, LLNL
- Kimberly Mayfield, Research Scientist, LLNL
--
Big Ideas Lab is a Mission.org original series.
Executive Produced by Levi Hanusch.
Script by Lacey Peace.
Sound Design, Music Edit and Mix by Matthew Powell.
Story Editing by Levi Hanusch.
Audio Engineering and Editing by Matthew Powell.
Narrated by Matthew Powell.
Video Production by Levi Hanusch.
Brought to you in partnership with Lawrence Livermore National Laboratory.
Hosted by Simplecast, an AdsWizz company. See pcm.adswizz.com for information about our collection and use of personal data for advertising.
Available Results
Generated results are saved to the knowledge database for reuse and search.
Extract Knowledge
Pick what you want extracted first. Model, scope, and chapter options appear after a template is selected.